Notice: Using Internet Explorer may cause some issues with loading dynamic content such as Cash Bids. Please use a modern browser such as Edge, Firefox, or Chrome.

Dynamic Weather Icon for Today's Forecast
Weather N/A

Soil Sampling Services


Building healthy soil, responsibly

Compliance with the 4R audit process and agronomy advice begins with using current soil test results (four years or less) to make responsible nutrient recommendations.

Our recommendation approach to nutrient management

We base our nutrient recommendation on a "BUILD, MAINTAIN or DRAW-DOWN" basis. 

  1. When soil sample values are low, we make recommendations greater than crop removal to build soil test levels. 
  2. When soil tests are at targeted levels, we maintain with crop removal values. 
  3. When soil tests are high, we make recommendations that are less than crop removal, and at times, a zero rate to draw-down soil fertility values and take advantage of over-applications from the past. 

This approach assures that nutrients are neither deficient, limiting crop performance, nor excessive, impacting the size of your environmental footprint. 

Optimizing harvested yield and maximizing nutrient use efficiency, is the goal. 


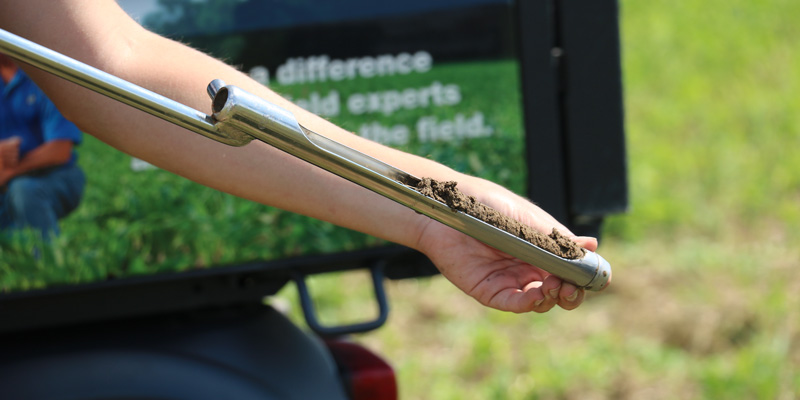
image of a soil sampling technician with a soil probe and soil inside the probe

We offer 4 main soil sampling programs

1) Zone sampling

Zone sampling has evolved from grids once we had access to yield maps and satellite imagery. These additional layers of information helped to define the stability of areas within fields that were the same consistent size and shape year over year. This made more intuitive sense to farmers and agronomist to match soil sampling and soil management to those unique zones.

To have a zone it must be stable year over year in size and shape and have attributes that can be measured. If you can measure it you can manage it. Things that can be measured tend to get managed.

The zone map is made ahead of time in our GIS software system and is sent to our soil sample operator to guide them to the designated areas to be sampled. All soil sample values are assigned to the management zones which in turn become the application zones that drive variable rate applications. The only other consideration is to realize that other soil attributes can emerge over time within larger zones and may require additional zones by added and sampled in subsequent years.

2) Grid sampling

Most grid sampling is done and recommended at 2.5-acre grid. It provides greater insight to field variability. It is a good way to inventory nutrient differences across a field landscape. The collected data supports variable rate Lime and Nutrient applications.

3) Composite sampling

Sample on every 25 acres, the maximum sample size for 4R Stewardship compliance. The management unit is 25 acres, the resulting recommendations and rates are based on single soil report result for that area. It limits the ability to address any field variability at a smaller scale with data.

4) The "Ultimate" sampling

The ultimate way to soil sample is with soil scans. For farmers keen on understanding soil properties in greater detail at a higher resolution to drive not only fertility applications but to run scripts for variable rate seeding and variable rate nitrogen based on unique soil properties that up until now have not been available at affordable fees.

We are using the SoilOptix® scanner technology and capturing the soils natural radiation and identifying the unique soil mineralogy that links to specific nutrient distribution in the soil profile. With the technology, we can define soil texture maps and show the % sand % silt and % clay, Plant Available Water, and Leaching index across the field landscape in addition to the traditional nutrients we normally measure.

The difference in the scanning technology and zones is we have the ability to represent nutrient distribution based on unique soil minerals and physical fractions of the soil. This results in a different looking map for potassium, phosphorus and all other nutrients rather than a traditional zone where the zone all has the same values for P and K and other nutrients.

The program begins by contacting our agronomist for a presentation and demonstration of how it all works.

A summary of how the service begins

We do need to drive the field with a special scanner attached to an ATV and collect the radiation readings. From that, we can:

  1. Group the readings into zones and assign soil sample locations.
  2. Collect the samples and submit them to the lab.
  3. Process the scanned data and prepare for the import of soil data to make the unique layers of soil properties.
  4. Finally, we can run our unique soil fertility scripts to determine the optimum nutrient application rates with a much greater resolution or detail related directly to soil properties and productivity.

Using your yield data

With all of these approaches and our data management system, we can incorporate your yield maps into the site-specific recommendations to represent the actual yields rather than assign an average yield value for the field.

It adds value to your yield data by replacing nutrients with greater precision in a variable rate scenario.

SoilOptix-on-AGRIS-machine-side-full1200-web

Contact your local AGRIS Crop Specialist

Your AGRIS Crop Specialist is here to help you with your crop planning, seed selection, and services needs.

Learn more

Create a myFS Account

Not yet registered?
Click the link below and select "Create Account" on the myFS login page to get started.

Register Now

Need help?
View instructions for setting up an account below.

Account Setup Instructions

Your choice regarding cookies on this site:

We use cookies to optimize site functionality and give you the best possible experience.
Privacy Policy

Your choice regarding cookies on this site:

We use cookies to optimize site functionality and give you the best possible experience.