By Cory Cowan
Crop Sales Specialist
AGRIS Co-operative - Chatham
Advanced Information Services (AIS) is the overall brand name we use to help position beneficial technology on your farm. We have all recognized that yields are impacted by the underlying aspects of soil water, slope position, soil organic matter and soil mineral content.
Every technology we have used is based on uncovering the drivers of this inherent and sometimes human-made variability.
Site-specific soil sampling, in particular, grid soil sampling, is entering its twenty-sixth year in Ontario. Grids have served us well to get a good foundational measurement of soil nutrient distribution within a field. It started us on a path of greater nutrient use efficiency by targeting areas of the fields with the greatest need for input adjustment while reducing rates in other areas that were either non-responsive or testing at levels beyond any agronomic significance.
As remote sensing and yield monitors improve, some farmers moved toward zone sampling. A management zone has to be the same size and shape year over year and the stability confirmed by two or more additional layers over more than one year. Management decisions are then based on the content of the individual zones. This offered an opportunity to increase the value of yield maps as a means to more accurately maintain soil test levels by matching crop removal rates to actual yields in the field rather than assigning an average yield to the entire field. It also offered an opportunity for more infield testing such as MiField and verification of practices.
The ultimate in nutrient use efficiency in a build, maintain and drawdown recommendation system is to use both the site-specific soil test and the yield map. To more accurately apply the required nutrients using our scripts that we have integrated into our data management system.
The next evolution is to implement soil scanning technology using the SoilOptix scanning system.
I think we all agree that soils, cropping systems and management of them is one of the main sources of the variability and therefore the opportunity to improve upon practices. Weather amplifies the magnitude and frequency of the changes which can make it challenging to evaluate practices and to know what is making the greatest difference in desired outcomes year to year.
The one constant is the soil. If you have a soil texture of clay you will always have clay. Sandy knolls will always be sandy knolls. The issue is what are subtle differences in particle size and clay content distribution that influence nutrient distribution, water content and yield potential and ultimately influences the nutrient profiles across the field, especially on fields with multiple soil types and topography.

- Just take a look at the various soil typesin the Rondeau Bay area.
- Each color is a different soil type withinherently different drainage class, depth of A horizon and slope
- Add in different cropping systems and landmanagement practices
- It can be become a challenge to measure thespatial variability of all the factors
- With the one constant being the soiltexture.
- SoilOptix can do a good job of characterizing the soil mineral and particle sizedifferences across the field that can influence productivity.
The soil scanner from SoilOptix is capable of measuring the gamma radiation signatures that are emitted from unique soil properties that directly link to clay content, soil minerals, particle size distribution at much higher resolution than ever before possible.
How it works
The SoilOptix® scanner reads gamma rays emitted by the soil that provide a complex picture of its condition at 335 points per acre. Physical soil samples are integrated into our readings. SoilOptix® uses proprietary software to translate this information into high definition digital maps. The resulting data is VRA ready to maximize seeding and input performance.


- On-board SoilOptix sensor mounted on one of our soil sample vehicles
- We drive over the field to capture the readings and geo reference them with the onboard GPS data system
- This creates the map that then determines where to take soil samples
- Soil samples are collected, sent to the lab
- When completed sample results and scanned data are merged to make the maps
- They are then imported into our data system ready for recommendations and application maps
Our service offers map layers of pH, BpH,Organic Matter, P, K, Mg, Ca, CEC, Base Saturations, zinc, manganese, % sand,silt. clay, loam-ability, and leachability index map.
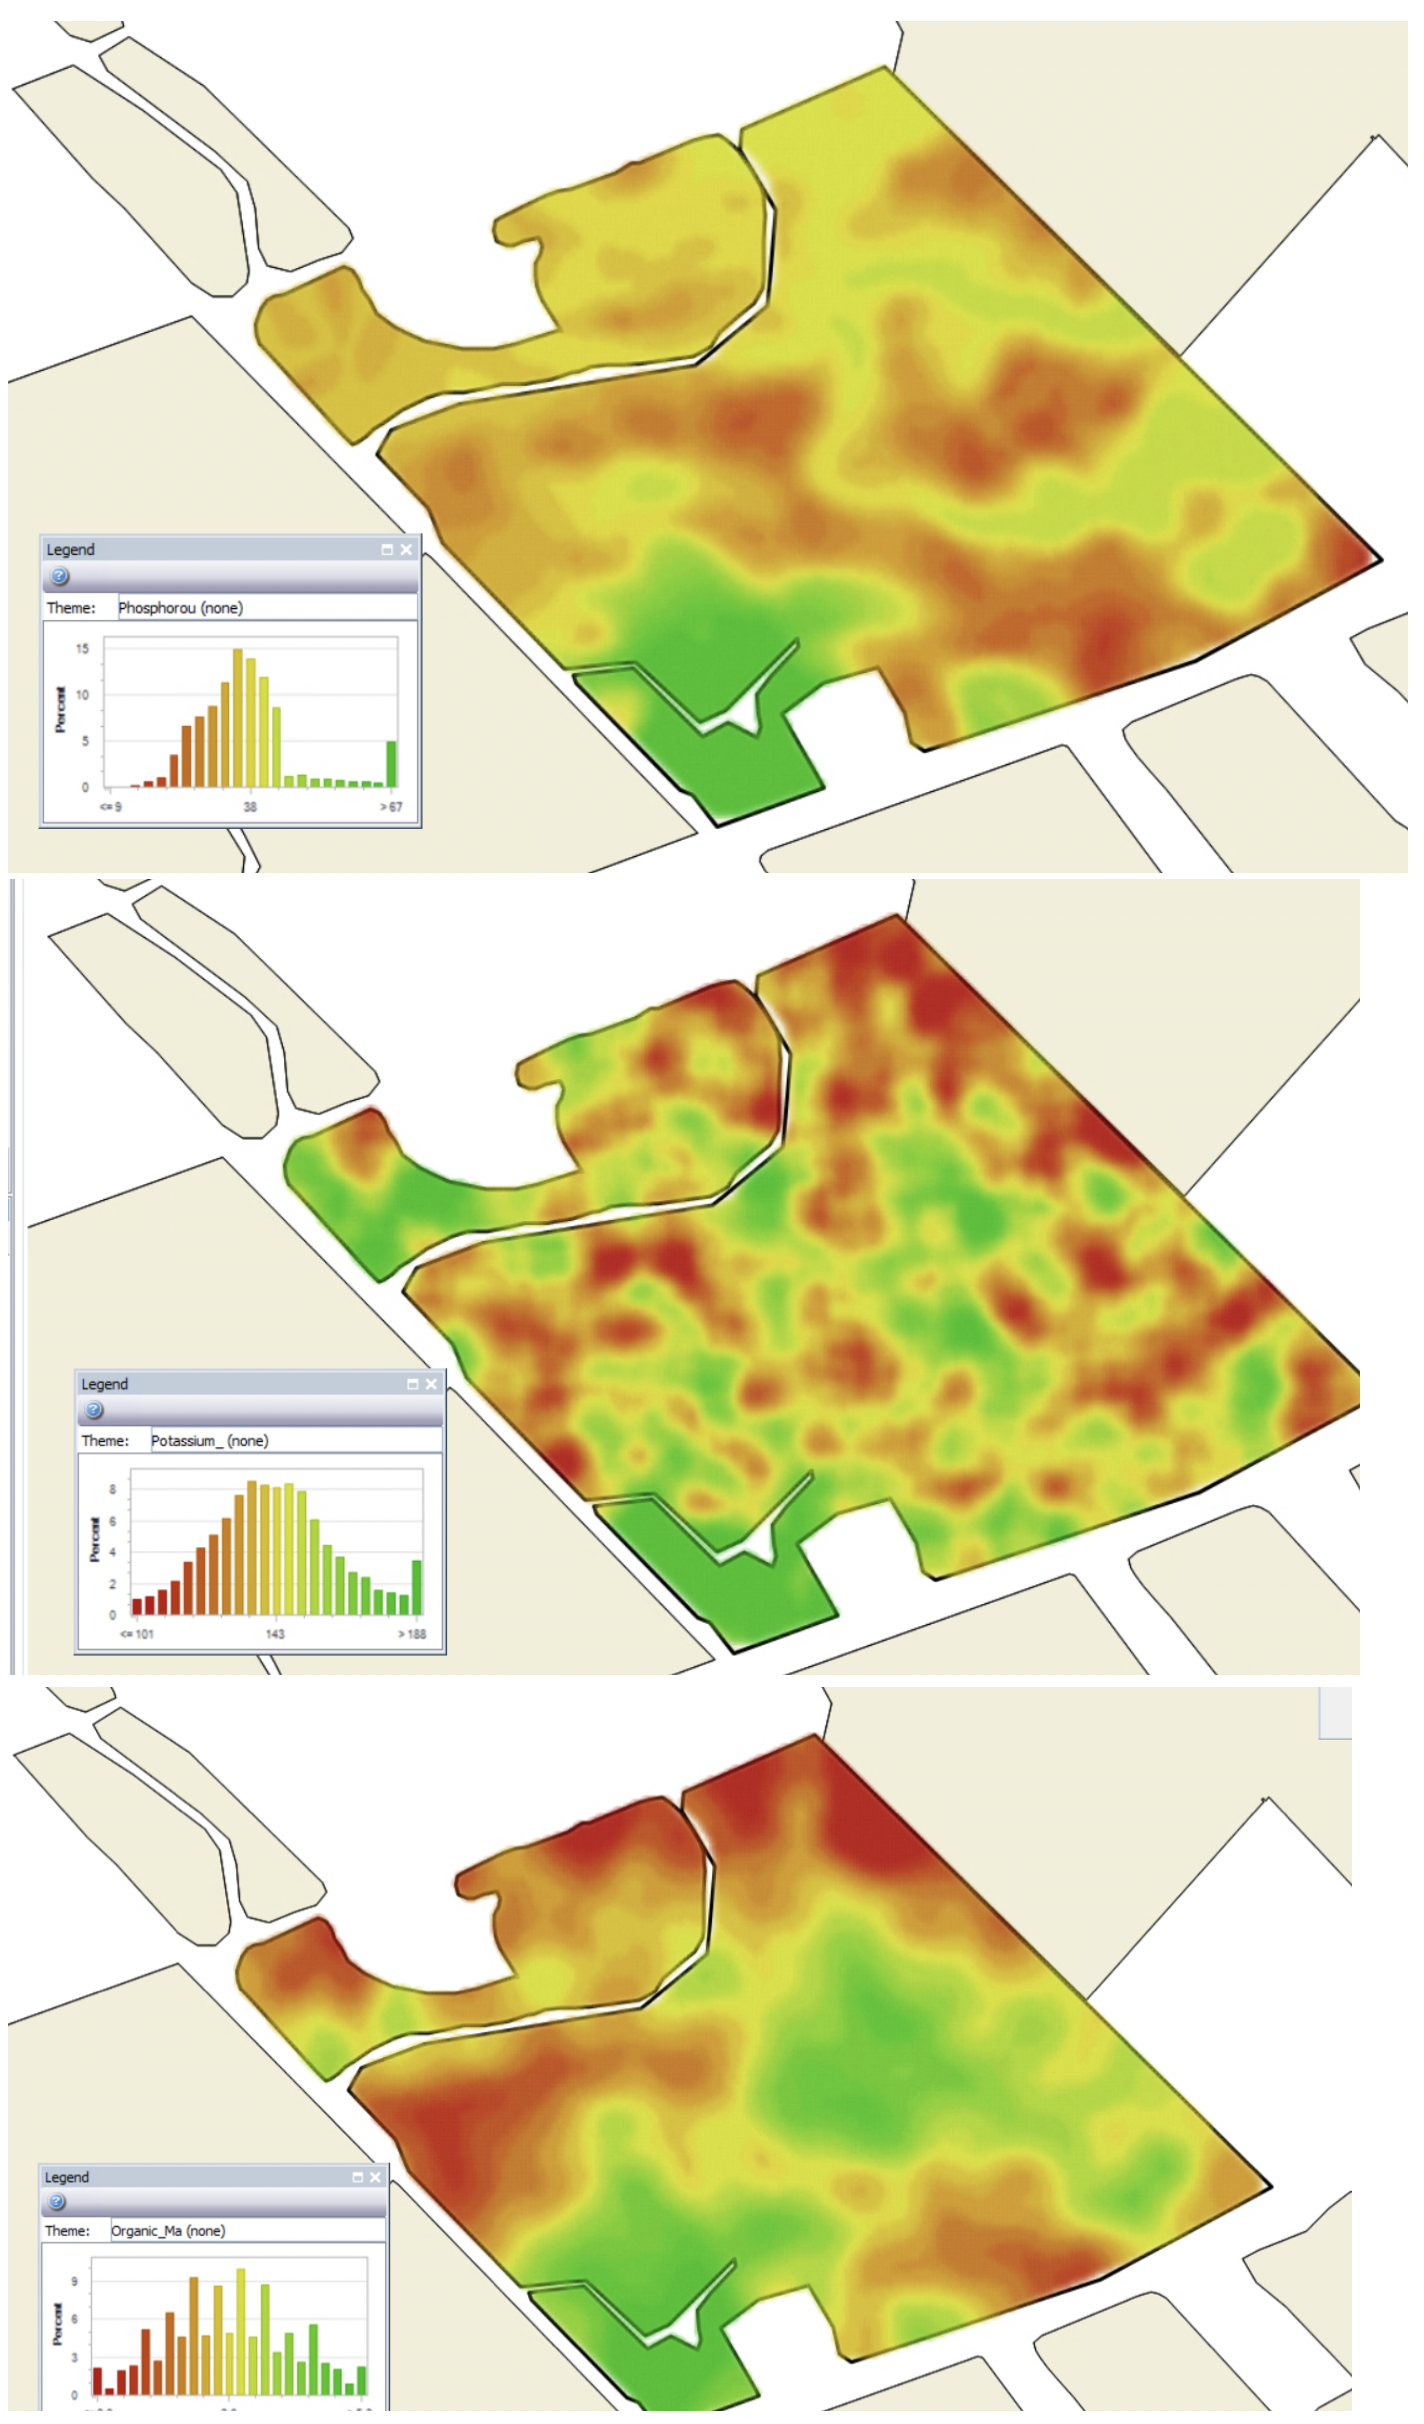
A sample of some of the maps are included below:
Soil test: P, K, and SOM

Soil texture: sand, silt and clay

Utilizing the additional information layers such as %sand , soil organic matter and a leachability index we can make better judgements on all nutrient applications including variable rate nitrogen applications,variable seed rates matched to soil water holding capacity and even predict the needs for foliar applications of nutrients and bio stimulants by being aware of areas within thefields prone to developing abiotic stresses when the weather is less favorable for crop growth.All of these activities support our 4R Nutrient Stewardship initiatives.
We are looking forward to expanding our scope of services to support more insightful input management and create those endure stewardship practices that produce better outcomes for our owners and customers.
To learn more, contact your crop specialist and schedule your field soil scan today.